New in SwiftUI 4: Customize Chart’s Y-Axis Marks in SwiftUI (iOS 16 +)
DevTechie Inc
DevTechie Inc

Apple introduced Charts Framework with iOS 16 and SwiftUI 4. Framework comes with many configuration options and is easy to build.
In this article, we will cover one of the customization option from Charts API to configure Y-Axis label AxisMarks.
Let’s start by creating data structure for our Chart.
We will create course category struct to represent video courses taught by DevTechie.com. We will make sure that struct conforms to the identifiable protocol so our Chart view can iterate over it.
struct DevTechieCourseCategory: Identifiable {
    var id = UUID()
    var name: String
    var numberOfStudents: Int
}
Let’s add some sample data so we can plot it on our Chart view. We will add sample data inside the extension with a static variable which will return an array of course categories.
extension DevTechieCourseCategory {
    static var sampleData: [DevTechieCourseCategory] {
        [
            .init(name: "SwiftUI", numberOfStudents: 8322),
            .init(name: "iOS", numberOfStudents: 10897),
            .init(name: "ML", numberOfStudents: 2324),
            .init(name: "UIKit", numberOfStudents: 2575)
        ]
    }
}
We are ready to start with our view. Import Charts framework and add a new struct conforming to the View protocol.
import Charts
import SwiftUIstruct DevTechieChartYAxisMarks: View { }
For the body property, we will have a NavigationStack, VStack, Text view and Charts view. Chart view will plot data in a BarMark.
struct DevTechieChartYAxisMarks: View {
    var body: some View {
        NavigationStack {
            VStack {
                Text("Total Students by Category")
                    .font(.title3)
                Chart(DevTechieCourseCategory.sampleData) { data in
                    BarMark(x: .value("Category", data.name), y: .value("Students", data.numberOfStudents))
                }
                .frame(height: 400)
                .padding()
            }
            .navigationTitle("DevTechie.com")
        }
    }
}
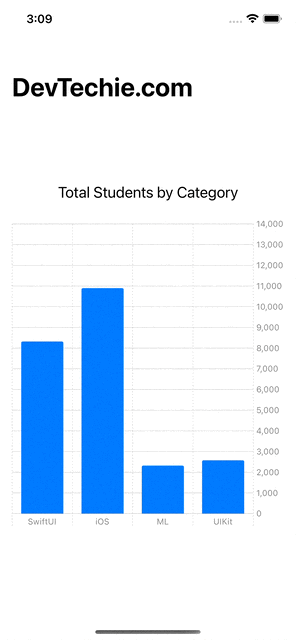
Note that our y-axis is increment of 5000, what if we want it to be every 1000 numbers?
We can change that by adding chartYAxis modifier to the Chart view. We will use AxisMark struct inside the ChartYAxis modifier to set values we want to display for y-axis.
We also need values which we need to display so we will create a new variable and generate values from 0 to 15000 with increment of 1000.
struct DevTechieChartYAxisMarks: View {
    let yMarkValues = stride(from: 0, to: 15000, by: 1000).map{ $0 }

    var body: some View {
        NavigationStack {
            VStack {
                Text("Total Students by Category")
                    .font(.title3)
                Chart(DevTechieCourseCategory.sampleData) { data in
                    BarMark(x: .value("Category", data.name), y: .value("Students", data.numberOfStudents))
                }
                .frame(height: 400)
                .chartYAxis {
                    AxisMarks(values: yMarkValues)
                }
                .padding()
            }
            .navigationTitle("DevTechie.com")
        }
    }
}
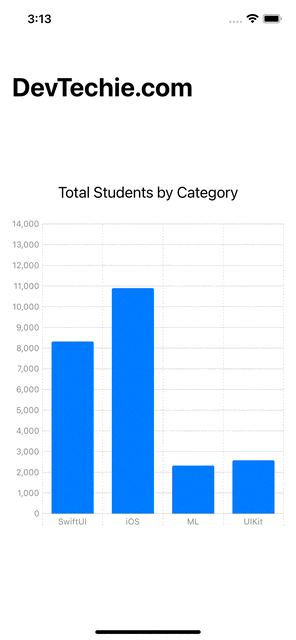
We can even move the position of y-axis to show it in leading direction.
struct DevTechieChartYAxisMarks: View {
    let yMarkValues = stride(from: 0, to: 15000, by: 1000).map{ $0 }

    var body: some View {
        NavigationStack {
            VStack {
                Text("Total Students by Category")
                    .font(.title3)
                Chart(DevTechieCourseCategory.sampleData) { data in
                    BarMark(x: .value("Category", data.name), y: .value("Students", data.numberOfStudents))
                }
                .frame(height: 400)
                .chartYAxis {
                    AxisMarks(position: .leading, values: yMarkValues)
                }
                .padding()
            }
            .navigationTitle("DevTechie.com")
        }
    }
}
With that we have reached the end of this article. Thank you once again for reading. If you liked this, don’t forget to 👏 and follow 😍. Also subscribe to our weekly newsletter at https://www.devtechie.com