- Jul 8, 2024
NVIDIA Stock Analysis Using MatPlotLib and Pandas
- DevTechie
- 0 comments
NVIDIA Stock Analysis Using MatPlotLib and Pandas
Problem Statement: We will use NVIDIA stock data downloaded from Kaggle to analyze its stock price by month and year. We will be using pandas for importing and aggregation and matplotlib for visualization.
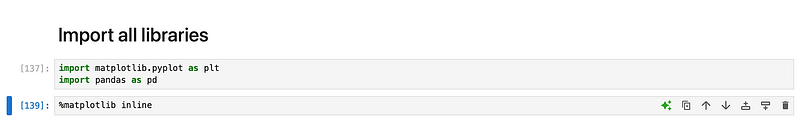
import matplotlib.pyplot as plt
import pandas as pd
%matplotlib inline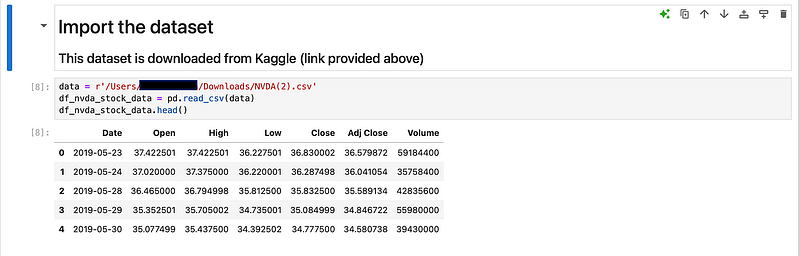
#Using pandas read_csv for csv format, use the function appropriate for your format
#e.g. read_excel, read_orc etc...
data = r'/Users/Downloads/NVDA(2).csv' # Use the path on your machine
df_nvda_stock_data = pd.read_csv(data)
df_nvda_stock_data.head()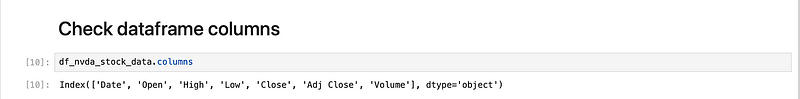
df_nvda_stock_data.columns
#Changing to correct datatype so aggregation can be applieddf_nvda_stock_data['Year'] = pd.to_datetime(df_nvda_stock_data['Date']).dt.year
df_nvda_stock_data['Month'] = pd.to_datetime(df_nvda_stock_data['Date']).dt.month
df_nvda_stock_data.head()
df_nvda_stock_data = df_nvda_stock_data.reset_index()
df_nvda_stock_data['Date'] = df_nvda_stock_data['Year'].map(str)+ '-' +df_nvda_stock_data['Month'].map(str)
df_nvda_stock_data['Date'] = pd.to_datetime(df_nvda_stock_data['Date'], format='%Y-%m').dt.strftime('%Y-%m')
df_nvda_stock_data.head()
df_nvda_stock_data_agg = df_nvda_stock_data[['Date', 'Close']].groupby(['Date']).sum()
df_nvda_stock_data_agg.head()
df_nvda_stock_data_agg.columns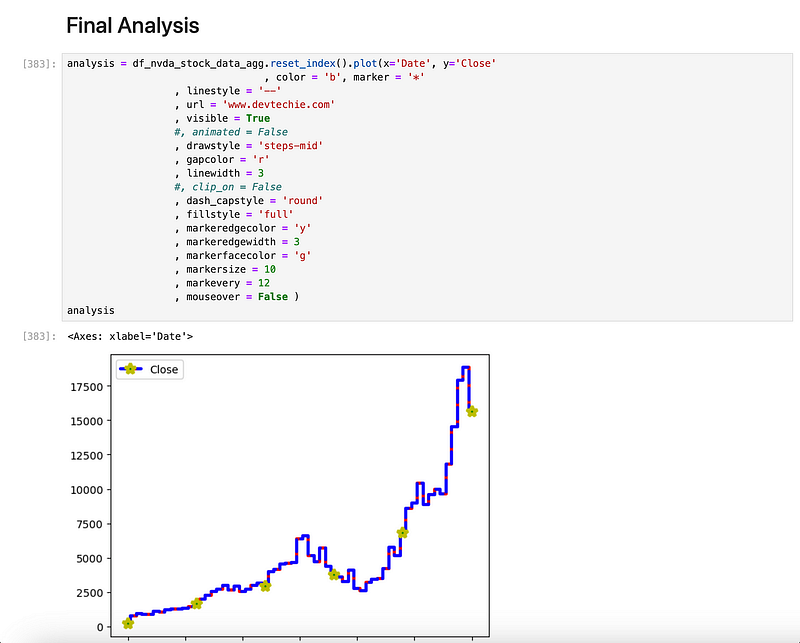
analysis = df_nvda_stock_data_agg.reset_index().plot(x='Date', y='Close'
                                 , color = 'b', marker = '*'
                  , linestyle = '--'
                  , url = 'www.devtechie.com'
                  , visible = True
                  #, animated = False
                  , drawstyle = 'steps-mid'
                  , gapcolor = 'r'
                  , linewidth = 3
                  #, clip_on = False
                  , dash_capstyle = 'round'
                  , fillstyle = 'full'
                  , markeredgecolor = 'y'
                  , markeredgewidth = 3
                  , markerfacecolor = 'g'
                  , markersize = 10
                  , markevery = 12
                  , mouseover = False )
analysis
Hope you enjoyed the NVDIA stock analysis! As you can see from July 2023 to around April of 2024 stock rise is almost vertical. Code snippet can be found here .
With that we have reached the end of this article. Thank you once again for reading.