- Jan 10
Bubble Chart — Superset
- DevTechie Inc
- Data Engineering
When do we want to create a Bubble chart? What kind of dataset is ideal for Bubble Chart? In this article, we will address these questions and learn through different dataset examples.
Bubble Chart is best when we want to compare and visualize 3 numeric values and a categorical dimension, 2 numeric values in X and Y axis and 1 representing the size of the bubble for volume and magnitude while fourth shows categorical dimension.
#Visual Element Data Type
X-axis Numeric (continuous)
Y-axis Numeric (continuous)
Bubble size Numeric (magnitude)
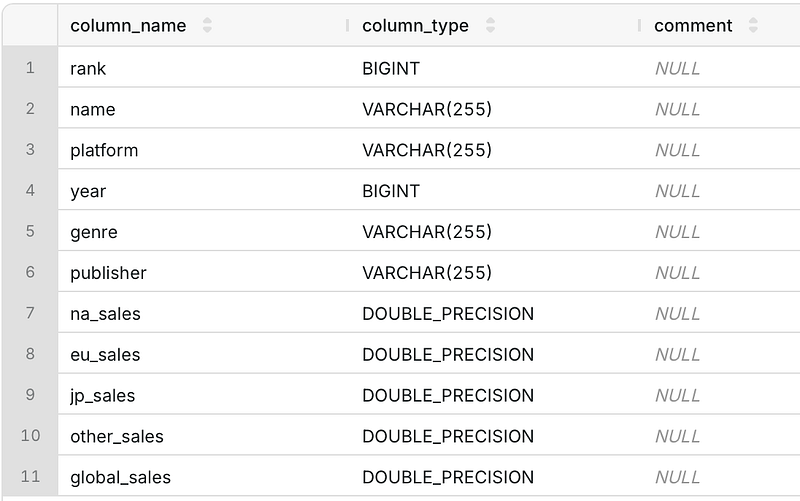
Bubble color CategoricalLet’s understand this with an example. Say we have video games sales data with below features.
Now, we can use Bubble chart to do comparison analysis for sales in different market.
Problem Statement:
To measure sales in North America(NA) vs EU while evaluating the total global sales for a given Video game.
Solution:
In this case,
X-axis - - - na_sales
Y-axis - - - eu_sales
Bubble size - - global_sales
Categorical Dimension - - Name (of Video game)
Our Bubble Chart would look like below. This shows biggest bubble at top right not only has highest sales for NA and EU but its big size shows high global sales.
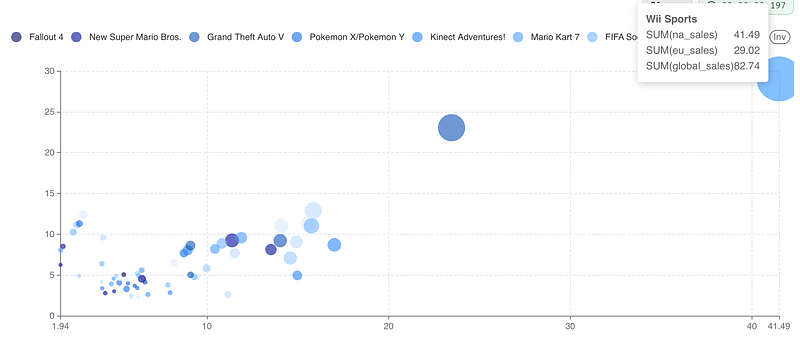
Now, assume if something was to come as big bubble on the top left corner os the chart would show high sales globally and in EU but not in NA and the team can look into it further.
Hands-on video :
Now we understand what a bubble chart is, let’s see a how to do this in superset.